← Course materials

EN.553.211 · Fall 2026 · Zan Ahmad

Chapter 9: Small-Sample Inference

The student notes follow the current 62-page lecture PDF. The online/classroom calculations are corrected using the data printed on slide PDF p. 47; see notes pp. 12–14.

Choose a topic below to move between the notes and slides. Page numbers refer to the PDF viewer. Page links work in supporting viewers; some mobile or embedded viewers open at page 1. If that happens, enter the page number shown here. The slides have a linked navigation strip above the original page; their content and page order are unchanged.

November 5 revision: notation follows the course slides; figures connect the equations to their meaning. Notes retain their existing page numbers. On a small screen, swipe a wide figure or open its full-size view.

The connection to Chapter 8
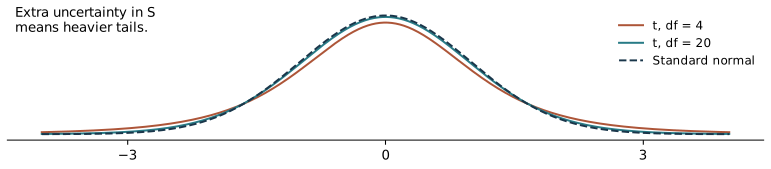
Under normal sampling, estimating sigma adds denominator variability. As df grows, the t curve approaches the normal curve.
Why t has heavier tails. Under normal sampling, estimating sigma adds denominator variability. As df grows, the t curve approaches the normal curve. Open full-size figure

Degrees of freedom

t curves, assumptions and table notation

One-mean confidence intervals
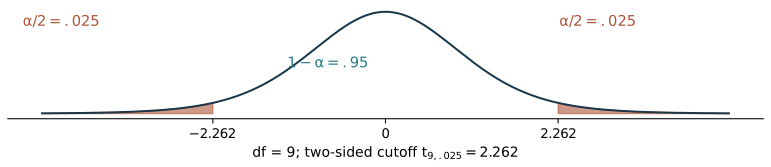
For two-sided confidence 1-alpha, use alpha/2 in each tail. The df row comes from the sampling design.
Read df and upper-tail area separately. For two-sided confidence 1-alpha, use alpha/2 in each tail. The df row comes from the sampling design. Open full-size figure

Diamond example

Why the t interval is wider

One-mean tests and the CI connection

Paint-coverage example

Independent means and pooled variance
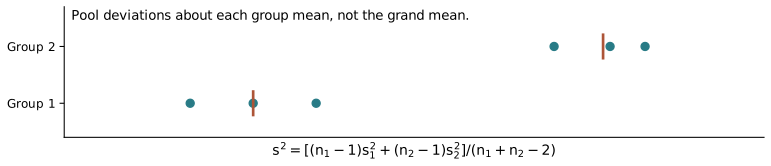
The slide notation s squared denotes pooled variance here. Two fitted means leave df = n1 + n2 - 2. Equal population variances are an assumption.
A common variance, two fitted means. The slide notation s squared denotes pooled variance here. Two fitted means leave df = n1 + n2 - 2. Equal population variances are an assumption. Open full-size figure

Online/classroom example: confidence interval

Pooled tests and the online/classroom example

Paired designs and the tire example
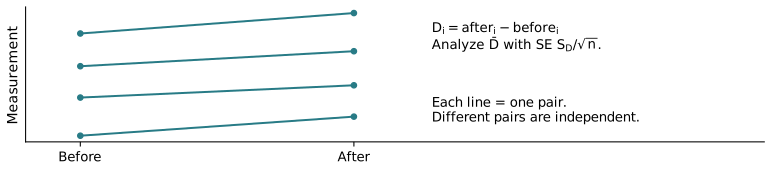
Use one difference per pair. The one-sample t method has df = number of pairs minus one, assuming independent normal differences.
Pairs become one sample of differences. Use one difference per pair. The one-sample t method has df = number of pairs minus one, assuming independent normal differences. Open full-size figure

Choosing and interpreting a method